Sin Matplotlib GIF - Ondas Sonoras
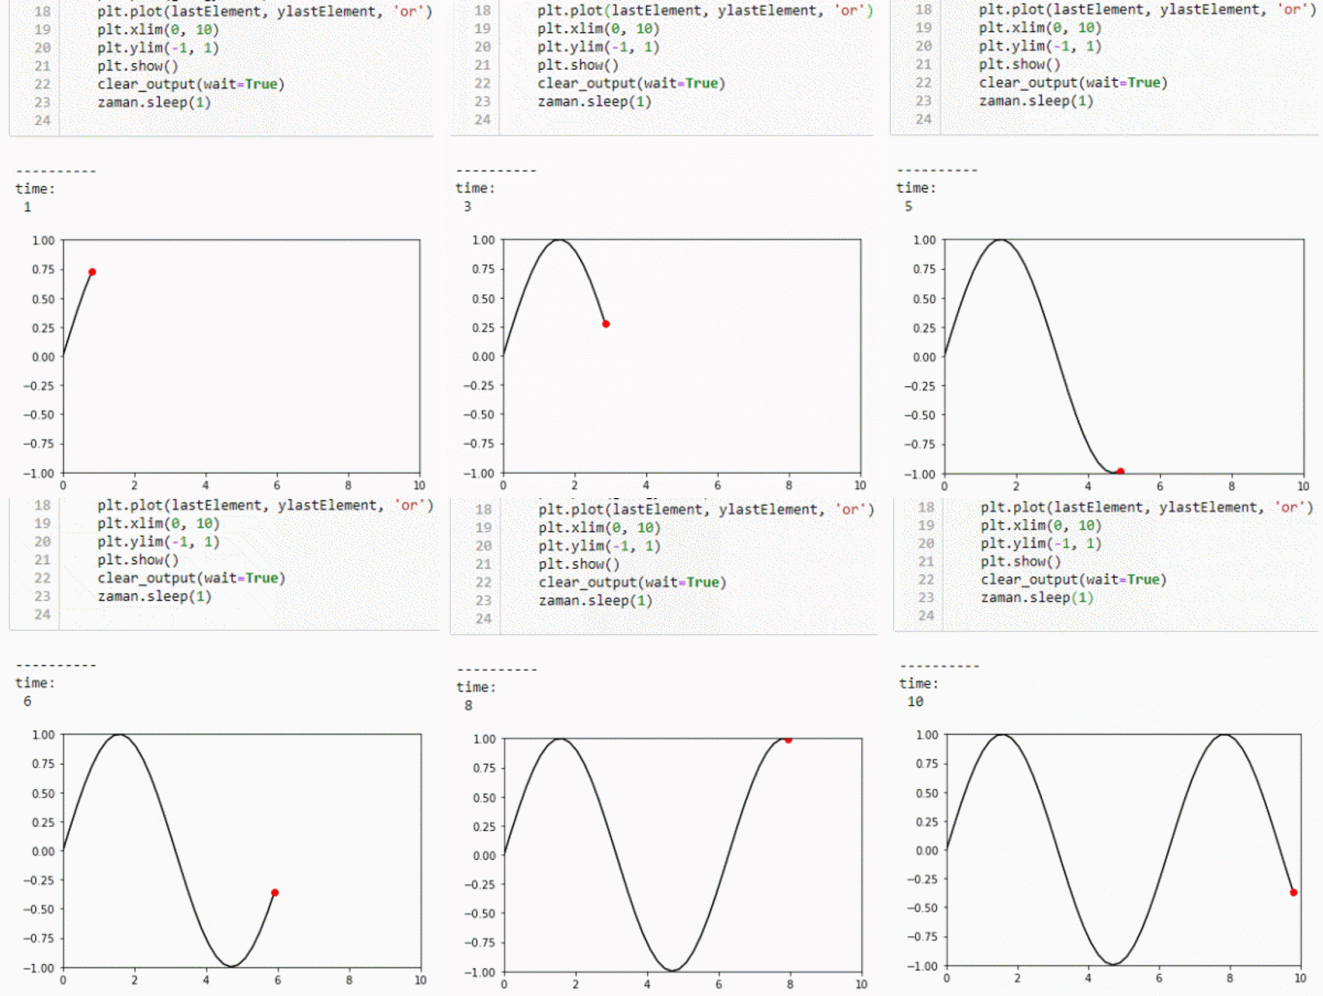
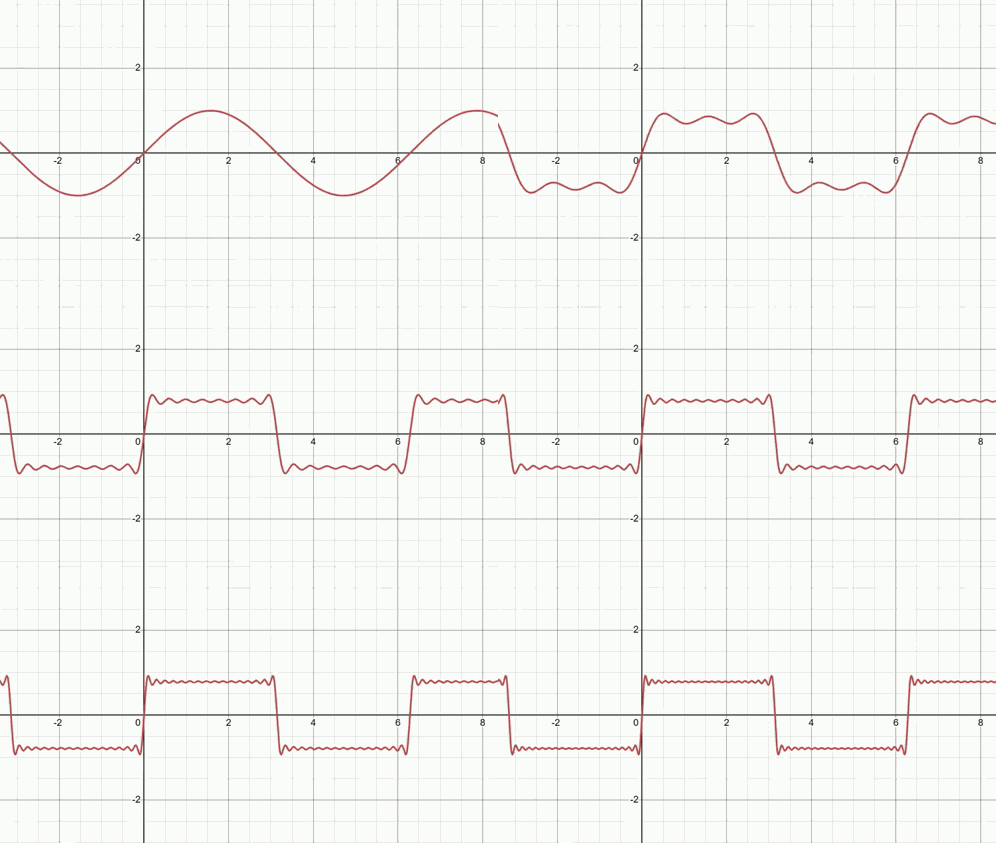
A sine wave graph evolves over time, starting as a sharp upward curve and forming complete oscillations across the plot area. This 441 x 498 animated GIF is part of our ondas sonoras collection. Created by etsw. View the original animation, share it, or browse related GIFs.
More GIFs similar to Sin Matplotlib GIF:
GIFimage.net

GIFimage.net

GIFimage.net
GIFimage.net

GIFimage.net

GIFimage.net

GIFimage.net
GIFimage.net
GIFimage.net
GIFimage.net
Link copied to clipboard!